pg_stats_reporter is a graphical report generator for pg_statsinfo. It offers you various statistical information collected by pg_statsinfo in a graphical and interactive representation. pg_stats_reporter 12 is compatible only with pg_statsinfo 12. You can see an example report here.
pg_stats_reporter runs in two ways. It runs as a CGI script and connects to repository server of pg_statsinfo in common usage but it also provides a command-line interface to generate off-line reports, which is portable form of the graphical report.
RPM package is available here.
If you would like to install from source, you will see instructions in INSTALL.en file in the top of source tree.
If you would like to use both of online and offline reports. You should install all files required by both of CGI and command line part of pg_stats_reporter. Following the steps below as a superuser will do that. pg_stas_reporter is distributed as an RPM package but subsidiary packages can be installed using yum.
The required packages are are installed by the steps like following using yum.
$ su
# yum install pg_stats_reporter-12.0-1.el7.noarch.rpm php-intl
$ su
# dnf install pg_stats_reporter-12.0-1.el8.noarch.rpm php-intl
If you don't need online reports, some of the packages are not required. Required packages for offline reports are installed by the steps like following. pg_stats_reporter package depends on php so --nodeps needed for this case.
* The php-intl RPM package for Red Hat Enterprise Linux is available via the subscription management services provided at Red Hat customer portal. It is required to activate automatic language selection (only instant help messages between ja/en) of an online graphical report.
$ su
# yum install php-pgsql php-intl php-cli
# rpm -ivh --nodeps pg_stats_reporter-12.0.el7.noarch.rpm
$ su
# dnf install php-pgsql php-intl php-cli php-xml
# rpm -ivh --nodeps pg_stats_reporter-12.0.el8.noarch.rpm
This section explains about required setups to run pg_stats_reporter.
Edit some fields in the configuration file so as to connect the repository database. Configuration parameters are described later. Sample configuration set up to connect to repository on local server is included in package.
Start the HTTP Service when you use online reporting. You may also have to set up firewall and SELinux properly to allow pg_stats_reporter to work.
# systemctl start httpd.service
If you would like to run HTTP server at the next time you boot the system, run the command below.
# systemctl enable httpd.service
You can confirm that pg_stats_reporter is properly installed by the following steps. The repository server should have some content to show.
See Accessing online report and go to the URL as explained there. The browser will come up with proper content if it is working well.
See Generating offline reports and list available snapshots on command-line. The command gives some snapshot IDs if it is working well.
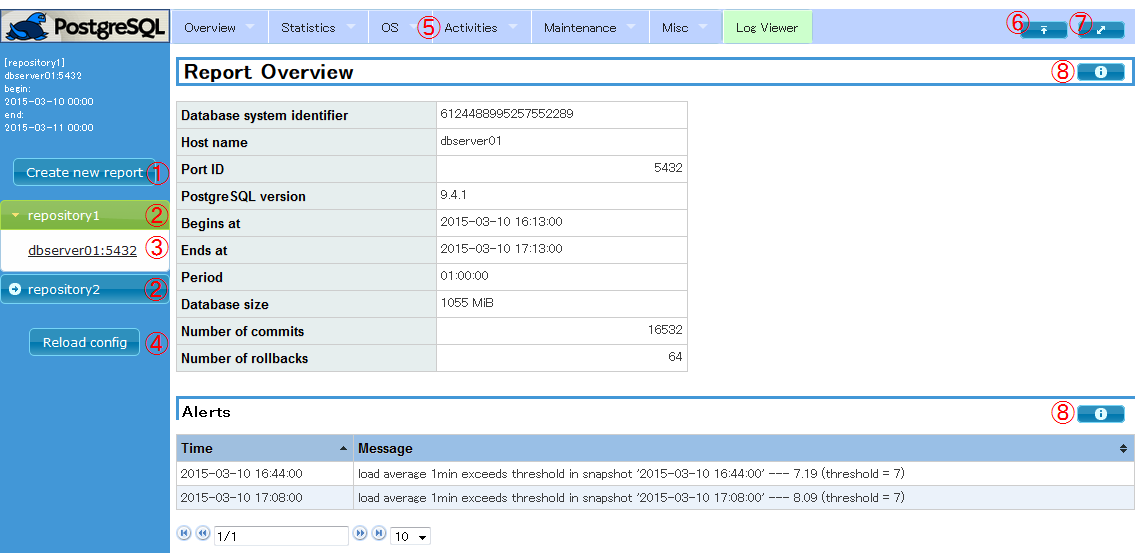
This section explain about the screen of online reports.
Entering the URL like following into address bar on your browser, you will see initial screen like the next section.
http://<hostname>/pg_stats_reporter/pg_stats_reporter.php
Operations on GUI in detail are following.


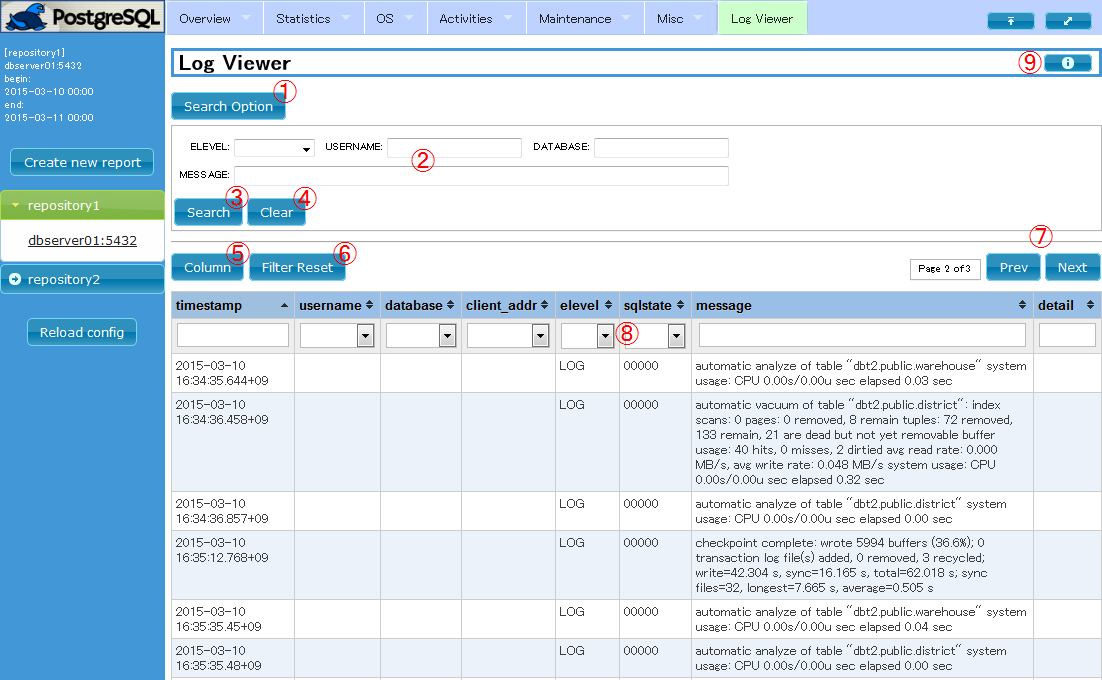
Different from other items, log viewer is shown in a dedicated frame.

$ pg_stats_reporter [-R DBNAME] [-i INSTANCEID] [-a] [-O DIRECTORY] [-b SNAPID] [-e SNAPID] [-B DATE] [-E DATE]
The very simple example below generates an offline report from snapshots in repository database named sample with default settings as following.
$ mkdir report
$ cd report
$ pg_stats_reporter -R sample
$ ls
css         js       sample_localhost_5432_1_20150528-0000_20150529-1650.html
index.html  package
$ pg_stats_reporter -l [-R DBNAME] [-i INSTANCEID]
The option "-l" instructs to do this. The following example lists all snapshots stored in the repository database "sample".
$ pg_stats_reporter -l -R sample
$ pg_stats_reporter -L [-R DBNAME]
The option "-L" instructs to do this. The following example command shows the list of the all target instances stored in the repository "sample".
$ pg_stats_reporter -L -R sample
$ pg_stats_reporter -s [-R DBNAME]
The options "-s" instructs to do this. The example command below shows the amount of disk space consumed by the snapshots in the repository database "sample".
$ pg_stats_reporter -s -R sample
$ pg_stats_reporter --index [-O DIRECTORY]
The options "--index" instructs to do this. The example command below creates the index page of the reports stored in /var/report. Doing this after you have deleted some reports updates the index page so as to display the content correctly.
$ pg_stats_reporter --index -O /var/report
pg_stats_reporter installed by RPM package is uninstalled by the following steps. The configuration file ('/etc/pg_stats_repoter.ini') is left alone by the steps, so you should delete it manually if it is not necessary.
* You will see the instructions to uninstall manually in INSTALL.en in the top source directory.
$ su
# yum remove pg_stats_reporter-12.0-1.el7.noarch
$ su
# yum remove pg_stats_reporter-12.0-1.el8.noarch
All settings for pg_stats_reporter are described in the configuration file "pg_stats_reporter.ini" in /etc directory, which is composed of two main sections, global settings and per-repository database settings.
Multiple repositories can be defined in the configuration file. You can choose one of them in the sidebar.
The section marker "[global_setting]" indicates the beginning of the global settings. If you installed following instructions, you don't need to change the settings here from the sample configuration file.
| Parameter | Type of value | Default value | Example | Description |
|---|---|---|---|---|
| install_directory | string | mandatory | install_directory = /var/www | Installation directory of this tool |
| log_page_size | 1 - 1000 | 1000 | log_page_size = 1000 | Maximum number of rows of the log viewer table |
Every repository requires one section describing settings about it. The section tag is the display name for the repository in the sidebar.
Available setting parameters are shown below.
| Parameter | Type of value | Default value | Example | Description |
|---|---|---|---|---|
| [repository name] | character | mandatory | [repository 1] | Section marker for this repository. The name is displayed as repository name in the sidebar of web interface. |
| host | hostname or IP address | (*a) | host = localhost | Hostname or IP address of the repository server. |
| port | port number | (*a) | port = 5432 | Port number to connect to repository server. |
| dbname | string | (*a) | dbname = postgres | Name of the repository database. |
| username | string | (*a) | username = postgres | Name of the User to connect to the repository database. |
| password | string | no password | password = foo-bar-baz | Password to connect to the repository server. Leave unspecified when .pgpass is used. |
| language | auto/ja/en | auto | language = ja | Language for web interface. auto means that the language will be determined according to the browser's request. Assumed to be "en" if php-intl is not installed. |
| Report items selection | true/false | true | summary = true | Specifies whether to show or not for each report item. All report items should have their own settings. They are prewritten in the sample configuration file. |
This section provides important information that can affect stability and information about what might be confusing. Be sure to read them before use.
A1. It might be caused by settings of firewall, SELinux or memory usage limitation of PHP.
getsebool httpd_can_network_connect_db
ls -dZ /var/www/pg_stats_reporter_lib/{cache,compiled}
A2. Repository connection settings in pg_stats_reporter.ini or access control setting of the repository database might be wrong. Make sure that they are correct.
A3. Use Firefox or Chrome instead. Internet Explorer is not recommended.
A4. Unfortunately, PHP is not recommended to be used on multithreaded MPM and we tested pg_stats_reporter only on prefork mode.
A5. It is brought about by the data for such instances left in the repository. You can remove such items by manually deleting the corresponding data in repository. See details here.
A6. Your browser may hold old JavaScript libraries in cache. Try clearing them.
Changes from pg_stats_reporter 11 are shown below.
Pg_stats_reporter uses many libraries. We are deeply grateful to the developers of these libraries.