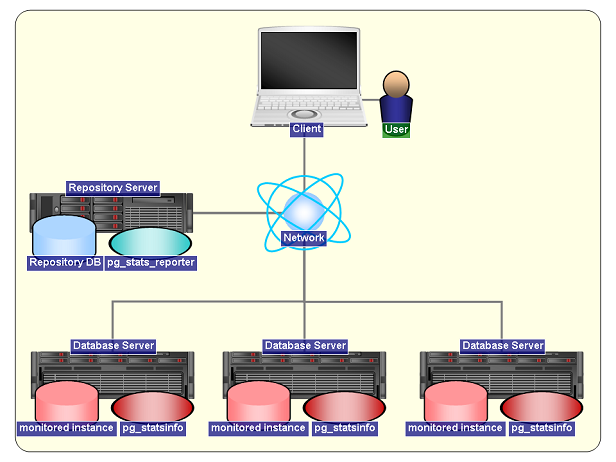
pic1: Example of system installed with pg_statsinfo
pg_statsinfo -- monitor statistics and activities of PostgreSQL server. It is easy to use pg_statsinfo that pg_statsinfo is working with PostgreSQL start or stop.
pg_statsinfo monitors an instance of PostgreSQL server and gather the statistics and activities of the server as snapshots. The snapshots will be stored in the same or another repository database. It also parses PostgreSQL's CSV server log files and extracts performance logs from them. Error messages are routed into text log and syslog according to the message levels.
pg_statsinfo can be easily installed and maintained because it starts or stops automatically when PostgreSQL server starts or stops. Also configuration parameters are integrated with setting files of the server. Statistics counters from pg_statsinfo can be displayed with pg_stats_reporter as graphical reports.
Represent a system structure image which is installed pg_statsinfo
pic1: Example of system installed with pg_statsinfo

pic2: Image of Functionary in pg_statsinfo
pg_statsinfo gathers statistics periodically and stores them as snapshots into a repository database. The repository can be in the same database with the monitored instance or in another instance. Also, one repository can store snapshots from multiple monitored instances.
Snapshot holds the following statistics information:
Size of a snapshot depends on the numbers of objects in DB. There are about 600 - 800kB per snapshot. In case of pg_statsinfo default settings, snapshots for each monitored DB requires 90 - 120MB per day.
Note that pg_statsinfo doesn't delete old snapshots. Please delete them manually.
If database statistics is over threshold which was set by user, pg_statsinfo detect and write alert log in postgresql-log(message level is 'ALERT').
Alert function can set following alert parameter:
(*1) Correlation of table is judged by only clustered table which is in cluster index.
How to set alert function, Please read following passage.
pg_statsinfo provide features that are creating reports and operations in command-line.
* How to use feature of command-line, Read this section.
This feature provide the create reporting command which create report from a repository database in your set period.
And it can also manage snapshots management in repository database.
Introduction of feature of creating report in command-line is "report item list of pg_statsinfo v2.5".
And outputted report items are same as pg_stats_reporter.
If you would like to output graphical reports, please use pg_stats_reporter.
pg_statsinfo also provide operation for repository server in command-line.
Providing features are under following.
pg_statsinfo execute auto maintenance at once every day. Executing operation is under following.
It is default ON and is executed in regular time.
(*1) When stopping feature of auto deleting snapshots, old snapshots are not deleted in repository server. So please delete snapshot manually in regularly.
(*2) When stopping feature of auto maintenance log files, old log files are not deleted in repository server. Please delete log files manually in regularly.
How to use feature of auto maintence is here.
$ su
# rpm -ivh pg_statsinfo-2.5.0-1/pg92.rhel6.x86_64.rpm
You can use pgxs to bulld the module from the source codes. You don't have to run sql files manually because pg_statsinfo installs them automatically for both monitored instances and repositories.
$ cd pg_statsinfo
$ tar xzvf pg_statsinfo-2.5.0.tar.gz
$ cd pg_statsinfo-2.5.0
$ make USE_PGXS=1
$ su
# make USE_PGXS=1 install
Note: RPMs of PostgreSQL 9.0, 9.1, 9.2 change the install directory path. Therefore, the RPM of pg_statsinfo also changes install paths. For example, executable files are installed to "/usr/bin" previously. But from PostgreSQL9.0, these files are installed to "/usr/pgsql-9.0/bin".
#minimam configuration
shared_preload_libraries = 'pg_statsinfo'       # preload pg_statsinfo libraries
log_filename = 'postgresql-%Y-%m-%d_%H%M%S.log' # pg_statsinfo need this log_filename setting
#recommended configuration
shared_preload_libraries = 'pg_statsinfo'       # preload pg_statsinfo libraries
custom_variable_classes = 'pg_statsinfo'

pg_statsinfo.snapshot_interval = 30min          # set snapshot interval
pg_statsinfo.enable_maintenance = 'on'          # enable maintenance mode('on' or 'off')
pg_statsinfo.maintenance_time = '00:02:00'      # Delete old snapshots every day in this time.
pg_statsinfo.repository_keepday = 7             # keep old snapshots in this period in maintenance.

log_filename = 'postgresql-%Y-%m-%d_%H%M%S.log' # pg_statsinfo need this log_filename setting
log_min_messages = 'log'
pg_statsinfo.syslog_min_messages = 'error'
pg_statsinfo.textlog_line_prefix = '%t %p %c-%l %x %q(%u, %d, %r, %a) '  # This format is same as syslog's format.
pg_statsinfo.syslog_line_prefix = '%t %p %c-%l %x %q(%u, %d, %r, %a) '   # This format is same as syslog's format.

track_functions = 'all'
log_checkpoints = on
log_autovacuum_min_duration = 0
#pg_statsinfo.long_lock_threashold = 30s        #threthold parameter for getting LOCK infomation
Attention in pg_statsinfo
Allow the user who run the PostgreSQL server to login the server without any passwords from localhost. The recommended method is "ident" authentication here. Add the following line to pg_hba.conf when you use "OS-user = DB-superuser = postgres", that is the most common case. Note that you will need to add it in pg_hba.conf in front of other methods. The ident authentication method with TYPE=local will be convenient on UNIX.
# TYPE  DATABASE        USER            CIDR-ADDRESS            METHOD [for UNIX]
local   all             postgres                                ident
Finally, setup postgresql.conf with the following setting when the monitored PostgreSQL instance stops. In this settings, the repository will be created in 'postgres' database on the same server with monitored database. See also "Configuration File" for other setting parameters.
log_checkpoints = on                      # record checkpoint activities
log_autovacuum_min_duration = 0           # record autovacuum activities
shared_preload_libraries = 'pg_statsinfo' # preload the library
In addition, contrib/pg_statsinfo.sql and contrib/pg_statsrepo.sql are installed automactically. So, you don't need to install them manually.
Also, if you use PostgreSQL 8.4 or later, pg_stat_statements is installed in 'postgres' database in the monitored instance, pg_statsinfo gathers the query statistics and add them into snapshot. If you will use it, run the following command only once at the fist server start.
# If you use PostgreSQL 9.1 or higher,
$ psql -d postgres -c "CREATE EXTENSION pg_stat_statements"

# If you use PostgreSQL 9.0 or lower,
$ psql -d postgres -f $PGSHARE/contrib/pg_stat_statements.sql
Please set under following parameters in postgresql.conf, if it is needed.
Explanation of above parameters are Configuration.
That's all. Install is finished.
This section is explained maintenance and configuration in pg_statsinfo.
You only have to start PostgreSQL server when you start pg_statsinfo. pg_statsinfo will be kicked to start by the server; It cannot run in standalone.
$ pg_ctl start [OPTIONS]
Also pg_statsinfo automatically stops when PostgreSQL server shutdowns. Non-smart shutdown with 'pg_ctl stop -m fast|immediate' might cause some error messages, but you can ignore those errors.
$ pg_ctl stop -m smart [OPTIONS]
If you would like to stop only pg_statsinfo's agent not with PostgreSQL server, execute under following command.
$ pg_statsinfo --stop [OPTIONS]
If you would like to start agent again, execute under following command.
$ pg_statsinfo --start [OPTIONS]
(*1) If you don't set "shared_preload_libraries = 'pg_statsinfo'" in postgresql.conf before starting postgres, you cannot stop and start pg_statsinfo's agent.
Pg_statsinfo gets snapshot every interval time. Interval time configuration is in the following.
example: snapshot interval time is 30min
pg_statsinfo.snapshot_interval = 30min
If you want to get snapshot manualy, you use SQL statsinfo.snapshot function(text DEFAULT NULL).
$ psql -d postgres -c "SELECT statsinfo.snapshot('comment')"
Feature of auto maintenance can delete old snapshot automaticaly.
Default setting is ON.
How to use feature of auto maintence is here.
If you delete snapshots by munual, execute statsinfo.maintenance(timestamptz) function in psql. Delete old snapshots which you set timestamps before.
Command example: Delete older snapshots than 2011-02-01 07:00:00.
$ psql -d postgres -c "SELECT statsinfo.maintenance('2010-02-01 07:00:00'::timestamptz);"
It can arrange log files automatically by feature of auto maintenance log files.
It is default ON.
How to use auto maintence log files is here.
In default setting, Alert function is always ON in each instance.
You can change the threshold of alert function and ON or OFF function.
And if you set off or (-1) alert setting, it can stop only part of alert functions.
If you want to change the threshold of alert function, you should update the alert function table.
And alert function is executed every snapshot and in more two snapshots in the repository server.
# UPDATE statsrepo.alert SET commit_tps = 3000 WHERE instid = <instance ID\>Example: Disabled alert of rollback / sec.
# UPDATE statsrepo.alert SET rollback_tps = -1 WHERE instid = <instance ID\>Exmaples: Disable Alert Function
# UPDATE statsrepo.alert SET enable_alert = false WHERE instid = <instance ID>
Alert setting table is stored alert function parameter and disable of enable
information.
Alert setting table is "statsrepo.alert". And, setting table's schema is in following:
| column | data type | default parameter | explanation |
|---|---|---|---|
| instid | bigint | - | instance ID |
| rollback_tps | bigint | 100 | ROLLBACK / sec |
| commit_tps | bigint | 1000 | COMMIT / sec |
| garbage_size | bigint | 20000 | garbage size (MB) |
| garbage_percent | integer | 30 | percentage of garbage size ratio(%) |
| response_avg | bigint | 10 | average time of query responce (sec) |
| response_worst | bigint | 60 | longest time of query responce (sec) |
| fragment_percent | integer | 70 | correlations in each tables(%) |
| backend_max | integer | 100 | Maximum number of backend |
| disk_remain_percent | integer | 20 | Ratio of disk space in table space(%) |
| loadavg_1min | real | 7.0 | Load average@1min |
| loadavg_5min | real | 6.0 | Load average@5min |
| loadavg_15min | real | 5.0 | Load average@15min |
| swap_size | integer | 1000000 | Amount of disk swap(KB) |
| rep_flush_delay | integer | 100 | Amount of replication delay(MB) |
| rep_replay_delay | integer | 200 | Amount of recovery delay in standby server(MB) |
| enable_alert | boolean | true | enable or disabele for alert function (TRUE is enable and FALSE is disable) |
Please don't delete an alert table's tuple.
If you delete the tuple, you can not set the alert function in the instance.
$ pg_statsinfo -r REPORTID [-i INSTANCEID] [-b SNAPID] [-e SNAPID] [-B DATE] [-E DATE] [-o FILENAME] [connection-options]
Example of command is under following. Under following command example shows create report in the repository database which is, hostname is localhost, port number is 5432, database is postgres, and user is postgres.
$ pg_statsinfo -r All -h localhost -d postgres -p 5432 -U postgres
$ pg_statsinfo -l [-i INSTANCEID] [connection-options]
Sample command is under following. Under following command example shows list of snapshots stored in sample database in the repository database which is, hostname is localhost, port number is 5432, database is postgres, and user is postgres.
$ pg_statsinfo -l -h localhost -d postgres -p 5432 -U postgres
$ pg_statsinfo -s [connection-options]
Sample command is under following. The command example shows snapshots size in "sample" database stored in repository database which is, hostname is localhost, port number is 5432, database is postgres, and user is postgres.
$ pg_statsinfo -s -h localhost -d postgres -p 5432 -U postgres
$ pg_statsinfo -S COMMENT [connection-options]
Sample command is under following. The command example shows getting snapshots with comment from database which is, hostname is localhost, port number is 5432, database is postgres, and user is postgres.
$ pg_statsinfo -S 'COMMENT' -h localhost -d postgres -p 5432 -U postgres
$ pg_statsinfo -D SNAPID [connection-options]
Sample command is under following. The command example shows deleting snapshots from repository database which is, hostname is localhost, port number is 5432, database is postgres, and user is postgres.
$ pg_statsinfo -D 123 -h localhost -d postgres -p 5432 -U postgres
$ pg_statsinfo --stop [connection-options]
Sample command is under following.
The command example shows stopping pg_statsinfo's agent in which is, hostname is localhost, port number is 5432, database is postgres, and user is postgres.
$ pg_statsinfo --stop -h localhost -d postgres -p 5432 -U postgres
$ pg_statsinfo --start [connection-options]
Command example is under following.
Is in under following command sample, connect monitored instance to start agent in host name is localhost, port is 5432, database name is postgres, and connection user is postgres.
$ pg_statsinfo --start -h localhost -d postgres -p 5432 -U postgres
Connect to database options is under following, it is same as PostgreSQL.
If you would like to get snapshot, Set monitor instance. Or if you execute other purpose, set repository database.
If you want to maintain snapshot repository, you configure automatic maintenance mode in postgresql.conf. Auto maintenance is executed every day. Enable auto maintenance mode is in the following.
pg_statsinfo.enable_maintenance = 'on'
pg_statsinfo.maintenance_time = '00:00:00'
pg_statsinfo.repository_keepday = 7
(*1) Feature of auto deleting snapshots is default ON.
(*2) When you use with feature of auto log files maintenance, please set pg_statsinfo.enable_maintenance = 'on' or pg_statsinfo.enable_maintenance = 'snapshot, log'.
(*3) If you don't use automatic maintenance mode, repository size will be very large. Plese maintenance repository manualy in every term.
(*4) If you use this setting in multi-monitoring instances with difference sttings, setting of deleting snapshot in repository server is set in shortest schedule. For exmaple, when you set pg_statsinfo.repository_keepday which is under following in postgresql.conf to eahc server, monitoring instance3's configuration is reflect in the repository database server.
<Monitoring instance1>
pg_statsinfo.enable_maintenance = 'snapshot'
pg_statsinfo.repository_keepday = 7
<Monitoring instance2>
pg_statsinfo.enable_maintenance = 'snapshot'
pg_statsinfo.repository_keepday = 5
<Monitoring instance3>
pg_statsinfo.enable_maintenance = 'snapshot'
pg_statsinfo.repository_keepday = 3
pg_statsinfo can execute auto log files maintenance shell script at once every day. It is default ON and is executed in regular time.
If you would like to enable this feature, set configuratoin in postgresql.conf.
Example: Compress CSV log files at 0:02 every day.
pg_statsinfo.enable_maintenance = 'log'     # auto maintenance settings
pg_statsinfo.maintenance_time = '00:02:00'  # time which is executed auto maintenance
pg_statsinfo.log_maintenance_command = '<PGHOME>/bin/archive_pglog.sh %l'  # Configuration of arrangement log files (*1)
(*1) <PGHOME>: install directory of PostgreSQL
(*2) archive_pglog.sh archive_pglog.sh is included shell script in package of pg_statsinfo. It compress CSV log files before one day in every day, and create compressed log file in log directory which is created by pg_statsinfo. And also, it deletes CSV log files which have been moved by its shell script.
(*3) Feature of auto maintence is enable in default setting.
(*4) When you use with feature of auto log files maintenance, please set pg_statsinfo.enable_maintenance = 'on' or pg_statsinfo.enable_maintenance = 'snapshot, log'.
(*5) If you omit configuration of log maintenance command, above command is executed.
Configuration parameters and usages are explained in the section.
pg_statsinfo uses postgresql.conf in the monitored instance for a configuration file. Settings in the configuration file are read at the instance's startup and reloads with 'pg_ctl reload'.
You must setup the following parameters before using pg_statsinfo. Some of the paramters cannot be changed online and require server's restart.
| Name | Setting | Description |
|---|---|---|
| shared_preload_libraries | 'pg_statsinfo' | Preloaded libraries. If you also use pg_stat_statements, append the module name with a comma like 'pg_statsinfo, pg_stat_statements'. |
| log_filename | 'postgresql-%Y-%m-%d_%H%M%S.log' | @ust set this format. If you want to change file name, must set order in "%Y, %m, %d, %H, %M, %S" in file name. |
| track_counts | on | Enables collection of statistics on database activity. |
| track_activities | on | Enables the collection of information on the currently executing command of each session. |
| log_min_messages | debug5 ∼ log | A message level threshoulds for server logs. The value must be more verbose than 'log', pg_statsinfo.syslog_min_messages, and pg_statsinfo.textlog_min_messages. |
| log_timezone | unknown, gmt, utc | Only those values are supported. |
| log_destination | must have 'csvlog', and can have 'syslog' or 'eventlog' optionally | pg_statsinfo always adds 'csvlog' and removes 'stderr' during startup. |
| logging_collector | on | pg_statsinfo always set it to this value during startup. |
There some optional parameters that affect pg_statsinfo's activities. They can be changed online when reloaded with pg_ctl reload.
If you use PostgreSQL 8.3, read 'pg_statsinfo.*' as 'statsinfo.*'.
| Name | Default Setting | Description |
|---|---|---|
| track_functions | none | Enables tracking of function call counts and time used. Set to 'pl' or 'all' if you want pg_statsinfo to gather the statistics. |
| track_io_timing | off | Collect statistics of read and write relation blocks and times. If you set would like to collect these stats, set on this parameter. [caution] If this parameter set on, it might cause lessor parformance. (This parameter can be set in PostgreSQL 9.2 or later.) |
| log_checkpoints | off | Causes checkpoints to be logged in the server log. 'on' is recommended. |
| log_autovacuum_min_duration | -1 | Causes autovacuums to be logged in the server log. 0 ∼ 1min are recommended. |
| log_directory | 'pg_log' | A directory for csvlog and textlog files. |
| log_filename | 'postgresql-%Y-%m-%d_%H%M%S.log' | A file format for csvlog and textlog files. The value should be contain %Y, %m, %d, %H, %M, and %S in this order. |
| log_rotation_age | 1d | Rotates logs in the specified duration. |
| log_rotation_size | 10MB | Rotates logs in the specified file size. The size will be compared with csvlogs. |
| syslog_facility | 'LOCAL0' | syslog facility |
| syslog_ident | 'postgres' | syslog indent |
| custom_variable_classes | - | Required when you set parameters that starts with "pg_statsinfo.". |
| pg_statsinfo.textlog_min_messages | warning | Minimum message levels for textlog (*1). |
| pg_statsinfo.syslog_min_messages | disable | Minimum message levels for syslog (*1). Event log is used on Windows instead of syslog. |
| pg_statsinfo.textlog_filename | 'pg_statsinfo.log' | Textlog filename. Should not be empty. |
| pg_statsinfo.textlog_line_prefix | '%t %p ' | A printf-style string that is output at the beginning of each textlog line. (*2) |
| pg_statsinfo.syslog_line_prefix | '%t %p ' | A printf-style string that is output at the beginning of each syslog line. (*2) Note that timestamp and process IDs appended by syslog is replaced to values of pg_statsinfo daemon. So, you need to add %t and %p to record the original values. |
| pg_statsinfo.textlog_permission | 0600 | Permission setting for textlog files. |
| pg_statsinfo.textlog_nologging_users | - | Text log filtering configuration. Exclude user for not to output pg_log.And if you would like to set multiple user, set values with separator ",". |
| pg_statsinfo.sampling_interval | 5s | sampling interval (*3) |
| pg_statsinfo.snapshot_interval | 10min | snapshot interval (*3) |
| pg_statsinfo.excluded_dbnames | 'template0, template1' | Unmonitored database names. |
| pg_statsinfo.excluded_schemas | 'pg_catalog, pg_toast, information_schema' | exclude schema when snapshots. |
| pg_statsinfo.repository_server | 'dbname=postgres' | Connection string to connect the repository (*4). You need to avoid password input. |
| pg_statsinfo.adjust_log_level | off | |
| pg_statsinfo.adjust_log_info | - | Configuration of SQLSTATE which is changing massage level for INFO(*5) |
| pg_statsinfo.adjust_log_notice | - | Configuration of SQLSTATE which is changing massage level for NOTICE(*5) |
| pg_statsinfo.adjust_log_warning | - | Configuration of SQLSTATE which is changing massage level for WARNING(*5) |
| pg_statsinfo.adjust_log_error | - | Configuration of SQLSTATE which is changing massage level for ERROR(*5) |
| pg_statsinfo.adjust_log_log | - | Configuration of SQLSTATE which is changing massage level for LOG(*5) |
| pg_statsinfo.adjust_log_fatal | - | Configuration of SQLSTATE which is changing massage level for FATAL(*5) |
| pg_statsinfo.enable_maintenance | 'on' | Setting of auto_maintenance.
|
| pg_statsinfo.maintenance_time | '00:02:00' | Maintenance time of the snapshots in repository server. |
| pg_statsinfo.repository_keepday | 7 | Maintenance period of snapshots in repository server. |
| pg_statsinfo.log_maintenance_command | <PGHOME>/bin/archive_pglog.sh %l | This parameter is server log cleanup command. If we use default shell, old server log is decommpressed. |
| pg_statsinfo.long_lock_threashold | 30s | Threashold of getting LOCK infomation in pg_locks. |
| pg_statsinfo.stat_statements_max | 30 | Upper limit of information in pg_stat_statements. |
| pg_statsinfo.stat_statements_exclude_users | - | Exclude user in pg_stat_statements. If you want to set multi user, you use separator ','. |
| pg_statsinfo.controlfile_fsync_interval | 1min | Set regular intervals of fsync() contorol file of pg_statsinfo. |
If you want to reset configuration parameters online, just modify postgresql.conf and send a reload signal with pg_ctl.
$ pg_ctl reload
This section is needed operations in install of pg_statsinfo system.
Please delete old log files(CSV log, text log) every period, or use feature of auto log maintenance.
if you want to rotate logs in arbitrary time, execute the following function on the monitored instance.
$ psql -d postgres -c "SELECT pg_rotate_logfile()"
If pg_statsinfo's agent is stopped, it doesn't affect the PostgreSQL server. However, agent have been stopped forever. If you would like to restart agent, restart your PostgreSQL server.
When you uninstall pg_statsinfo, you have to restart PostgreSQL server after removing 'pg_statsinfo' from shared_preload_libraries and all of pg_statsinfo.* parameters in postgresql.conf.
After that, drop all objects used by pg_statsinfo installed in the monitored instance. Run $PGSHARE/contrib/uninstall_pg_statsinfo.sql for 'postgres' database in the monitored instance.
$ psql -d postgres -f $PGSHARE/contrib/uninstall_pg_statsinfo.sql
If you also want to delete snapshots, run $PGSHARE/contrib/uninstall_pg_statsrepo.sql to the repository. Be careful to run the script file because it will delete all of snapshots including other server's ones when the repository was shared by multiple monitored instances.
$ psql -d <repository> -f $PGSHARE/contrib/uninstall_pg_statsrepo.sql
There are still some restrictions and limitations in pg_statsinfo.
Pg_statsinfo gets snapshot and stores it in statsrepo schema. If you want to confirm if pg_statsinfo waorks normal, you can use under following SQL.
$psql -d postgres -c "SELECT statsinfo.snapshot('test')"
$psql -d postgres -c "SELECT * FROM statsrepo.snapshot WHERE COMMENT = 'test'"
If you execute 2nd SQL and get result, pg_statsinfo works normal.
Pg_statsinfo's snapshot function has only getting PostgreSQL's statistics every uniform regularly. If you want to see useful and visual report from snapshot, you can use pg_stats_reporter. Example of pg_repoter's output report is here.
It might be auto maintenance configuration is off. Confirm under following configuration in your postgresql.conf.
Enable alert function in postgresql.conf and set commit alert threshold 0, finaly get snapshost in command line or automaticaly
If it works collectly, alert messages were outpted in log messages.
Example setting SQL is under following.
# UPDATE statsrepo.alert SET enable_alert = true, commit_tps = 0;
After you confirm to work collectly, set propety value or default value.
First, uninstall old version. Next, install new version.
In new version, it cannot use snapshots which was get in old version.
Please read Uninstall, and drop old pg_statsinfo's schema.
Then you restart postgres, it will be work.
It might not have snapshots in repository database or only stored two or less snapshots.
It should need two over snapshots to create report. Please get snapshot more or wait for getting snapshot automaticaly, then create report.
pg_statsinfo 2.4 is changed under following points
More advanced usages and internal structures are explained in the section.
We can set Multiple instance and One Repository system. If you want to set the systems, you set following parameter in each instance and less password setting in repository.
pg_statsinfo.repository_server = 'hostaddr=192.168.0.32 port=5432 user=postgres dbname=postgres'
Warm standby can be used together with pg_statsinfo. There are two typical setups for warm standby mode. See also "pg_statsinfo: warm-standby" for details.
pg_statsinfo consists of a library and a daemon. The library is loaded by PostgreSQL server, and the daemon is run as a database client. Since the daemon is executed from a hook function in the library, users don't have to execute the daemon explicitly. See also "pg_statsinfo: internal" for details.